Flood influence analysis using satellite imagery

Anastasiia Dolgaryeva
Delivery Manager
The flood that occurred on the 15th of July, 2021, was a severe disaster whose impact reached lands beyond the country. On the 14th of July, the Royal Netherlands Meteorological Institute constituted a significant risk of the Limburg province being overflown (a.k.a. red warning) due to heavy rain. However, they gave a less pessimistic estimation of the danger right before the rain started.
The flood had the 5th level of danger. It hit the province the same day, causing electricity outages due to equipment failure. 100 millimeters (3.9 in) in a day and 200 millimeters (7.9 in) over three days of precipitation have fallen over this period. Rescued citizens reported a lack of even necessary provisions such as food supplies.
The Copernicus Emergency Management Service (CEMS) has published a short report examining the areas suffering from heavy rains. The river Maas has received an enormous amount of water, and the heavy rain caused river levels to rise downstream. CEMS also made available geospatial information regarding this event. We can observe in blue in Figure 1 the flooded areas. Other shapes in the picture are occupied by local town infrastructures and buildings.

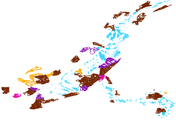
As of 21st of July, the area’s inhabitants were still subject to the evacuation order, and the consequences of the disaster were not removed. In the aftermath of this, more than 2000 houses were considered uninhabitable.
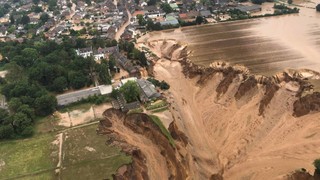
Even more disastrous, it turned out to be for Germany and Belgium.
In the image, you can see one of the cities and several fields that suffered from flooding.

There is little to be done in the precise aftermath of the disaster from a satellite data processing perspective but to study a peculiar climate phenomenon. Almost constant cloud cover was overcast nearly two months after the event and almost a month before. Disaster response projects and climate scientists should study such a phenomenon.
Effects on the agricultural sector
According to the EU farmers’ association COPA-COGECA, this event disrupted the agricultural sector to such a degree that harvest outage was expected, the most severely affected being still Germany and Belgium. The flood caused significant soil erosion. Fruit and vegetable plants were practically considered to be lost.
Besides open fields, Gartenbau-Versicherung, a German horticulture company, reports that many greenhouses were flooded over 3 meters with water, destroying any hope for at least some harvesting.
“It’s too early to say [for Europe], but what is grown in the province of Limburg is lost. The German Pfalz area is the main production area at this time of the year. How big the losses are, until now, there is no indication. There will be a problem for sure, but how big, nobody knows.”, reports Nico Veldhoen, commercial director at Staay-Hispa Papendrecht, an influential fruit and vegetable agroholding in the Netherlands.
According to the World Meteorological Organization, flooding has some benefits for ecosystems in general. Depending on the specific soil composition, it can increase soil fertility and enhance biodiversity. However, each area’s specifics have to be taken into account.
Data
We decided to analyze flooded areas using our platform for automated geospatial analytics. The research matter regarding the recent European flood plot boundary detection model has been applied to the flooded area in the Netherlands.
We started our research by detecting flooded parts inside the area of interest. We used Sentinel-1 to detect floods. Unfortunately, no satellite imagery data covered all the investigation areas. We used two captures: the 12th of July (three days before the flood) and the 18th of July (three days after).
To analyze the influence of floods on crops, we used Sentinel-2 data.
It is worth emphasizing that the closest dates before and after the disaster were quite far in time; that is, Sentinel-2 tiles with little cloud percentage found are of the 1st of June and 25th of August, while heavy rain occurred on the 15th of July. However, there was a semi-cloudy image on the 21st of July.
A few concerns to be pointed out:
- As is usually the case, the fields of European countries are considerably small in area; when visualized, each field is highly pixelated.
- Some fields were almost unaffected by the flood. For others, the actual reason and nature of anomalies can be hypothesized due to the flood; there is still uncertainty.
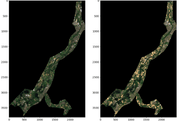
In Figure 3, we can see the TCI (True Color Image) of the investigated area for two dates: the 1st of June (the date before the flood) and the 25th of August (the date after the flood). Rasters images are located in the 31UGS tile of the Sentinel-2 satellite. The total area of analysis is about 80 sq. km. The data was obtained from our platform using the TCI_NDVI option on the selected area.

Analysis
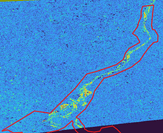
To detect flooded areas inside AoI, we compared remote-sensing data from Sentinel before and after the flood. In Figure 4, you can see red territories – the most water detected after the flood.

We performed field boundary detection using a neural network processor inside our service, which can help farmers and governments to analyze field usage.
We compare fields before and after the flood. The plot boundary detection pipeline yielded 1503 and 1357 fields for images made on the 1st of July and 25th of August, respectively. As you can see, the number of detected fields decreased, so we can assume that some areas were ruined and merged for satellite imagery. In such a way, we can recognize the scale of the disasters.
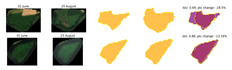
According to the received data, we made a few hypotheses (for each of them, there are a few examples shown as 5 images: 1, 2 – true color before/after, 3,4 – field shape before/after, 5 – an intersection of field areas):
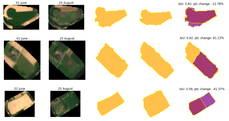
- Some fields have patches of water remaining after the flood or have been shrunk by lake overflow. In Figure 5, you can see examples of such areas.
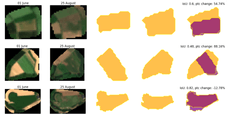
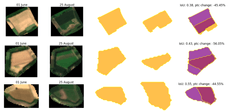
Figure 5. Partly flooded fields. - In Figure 6, some erosion-like phenomena can be observed in some fields.
Figure 6. Fields with erosion - Some areas changed their shape and/or content due to other events unrelated to the flood (or not directly related). Examples are shown in Figure 7.


Here, some fields remain water for even a month after the flood.
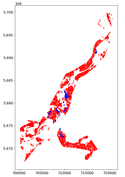
We calculated the number of flooded fields three days after the flood using a map with flooded areas. We detected 51 fields flooded after the disaster. In Figure 8, you can see flooded (blue) and non-flooded fields (red).

Our goal was to determine whether the plants were stressed from the flood. Our platform provides functionality to detect plant stress in each field. Plant stress is an anomaly of NDVI (Normalized Difference Vegetation Index). The NDVI is a dimensionless index that describes the difference between visible and near-infrared reflectance of vegetation cover and can estimate the density of green on an area of land. We calculated and compared the mean plant stress of flooded fields with fields unaffected by the flood. On figure 9, you can see the distributions of mean plant stress.


As you can see, the distributions are completely different. Flooded fields are mainly of two types: no stress and more stressed than others. That is because flooded fields have water on them, so the NDVI is nearly the same or more stressed due to the water’s presence.
After achieving such a distribution, we decided to compare the same fields in a month (25th August). The distribution obtained there is in Figure 10. Here we can see that distributions are nearly the same. A comparison of distributions was performed using the Kolmogotov-Smirnov test and was successfully passed with a threshold of 0.05. However, we can see that, in general, there are more fields with more significant plant stress.


Conclusions
- Plot boundary analysis using our platform suggests the influence of floods, such as localized small water bodies, even a month after the flood.
- There are soil degradation occurrences observed. Although such a disaster is the most likely explanation for water erosion, additional evidence is needed to conclude that the flood event was the only reason for its emergence.
- Local water bodies (lakes) seem to be overflowing even a month after the flood.
- Sentinel-1 imagery can help in the accurate detection of flooded areas and fields.
- Plant stress can be a metric to determine water on the field.
- Plants can normalize their growth a month after the flood.
Read more: How to estimate CO2 with satellite data (using GeoAP)