Field boundary detection: approaches and challenges

Michael Yushchuk
Head of Data Science
Today, we have powerful tools to improve agriculture management and performance optimization with technology development. Remote sensing, such as satellite imagery processing, is an excellent example.
The importance of land-use statistics is undeniable in modern farming and business. Accurate and up-to-date mapping of land usage requires precise land classification, which is complicated without the detection of field boundaries.
Usually, existing maps are based on historic administrative maps or manually developed based on observational data. The first ones do not stand up to high accuracy. The second one involves significant manual labor that scales with the number of maps created or updated. Neither of these two survives the scrutiny of variability with time. In such circumstances, yield predictions will not produce accurate estimations and might result in shortages or disrupt particular goods markets.
Crop area protection is another field of interest in agricultural management and benefits significantly from such maps. Given the growing trend in consumption common to both developed and still developing countries’ cropland, protection secures yields and preserves soil fertility.
Thus the crop field boundary detection problem is present in multiple areas and, despite many solutions already present, still under development. Let’s focus on some of these solutions and discuss the main advantages and challenges you can face during the implementation.
Plot boundary detection with a classical computer vision approach
From the standpoint of classic techniques, raster analysis could tackle this problem. The paper Boundary Delineation of Agricultural Fields in Multitemporal Satellite Imagery discussed this one approach in depth. A team of researchers had an objective to develop an algorithm to detect the boundaries of New Zealand farm fields from satellite images.
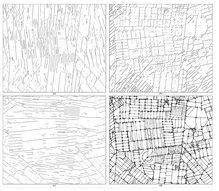
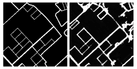
The process starts with selecting seven sequential dates for red, near-infrared (NIR), and short-wave infrared (SWIR) bands. The algorithm involves extensive image analysis (i.e., bands), calculating standard deviation per small radial window (as the original paper suggests with a radius of 5 pixels), resulting map that is averaged, and convolved with directional filters to find potential lines, thus yielding one image per direction filter (16 filters in the paper). Figure 1 shows a few of them. The resulting images are then subjected to the threshold value and combined using element-wise OR operation for each pixel. During the vectorization step, lines are thinned, smoothed, and trimmed; lines are extended and filtered out if they do not form a closed contour. And as a final result, a map of boundaries is ready.
Accuracy assessment, however, concludes that this method is applicable, where up to 20 m error is good enough. A more strict evaluation gives an accuracy of only 59%.
As we tried to implement such logic in our research, we discovered that this setup is quite brittle.
Several different thresholds had to be applied, but these threshold values work for images taken in spring and do not provide good results for ones taken in autumn.

Classic machine learning algorithms for boundaries detection
Classic computer vision approaches alone do not produce great results for a task like ours. Deep learning approaches, on the other hand, require vast amounts of labeled data. Is there a way to achieve reasonable enough accuracy with small datasets?
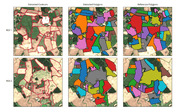
Classic machine learning algorithms usually work best with limited datasets. One of the pipelines is proposed in the paper: A machine learning approach for agricultural parcel delineation through agglomerative segmentation. The research group used images derived from calculated indices, namely, normalized difference vegetation index (NDVI), normalized difference water index (NDWI), and spectral shape index (SSI). Such images allowed them to derive superpixels, local clusters of pixels, producing additional feature maps for the next step. Researchers trained the RUSboost classifier to perform binary classification for pixels.
This technique allowed a team to achieve 92% accuracy, which is impressive given a small amount of data and a relatively simple data preprocessing procedure and model training.

Graph-based contour finding
Contour finding is another technique that could apply to the plot boundary detection task. The idea is suggested in the paper Extracting Agricultural Fields from Remote Sensing Imagery Using Graph-Based Growing Contours.
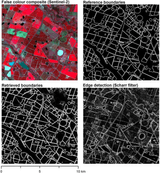
Active contours finding, also called “snakes,” is not new in computer vision. However, as the authors discussed, some common drawbacks can be addressed, such as skipping rough corners. Also, mentioning this can add complexity to an algorithm. The researchers from Kiel University picked a subject area of Schleswig-Holstein state dominated by agricultural use. A series of transformations before actual contours finding was performed to tackle the task, particularly bilinear filtering, the color-space transformation between YUV and RGB color spaces taking gradient finding local anisotropy.
Finally, preprocessed images consist of informative feature maps that allow active contours finding, as such procedure is based on the notions of internal and external energies. While gradient image provides rich information for the former, sub-pixel transformation does so for the latter. The approach to active contour finding is altered, however. First potential fields are seeded in the most likely points based on descriptors derived from preprocessing steps. Next, weighted graph building starts with the seed being the first node. Such a graph would be built as a circle, but weight assignment and recalculation allow Afterall to prune vertices and edges whose weights are too small. Obtained contours then transform polygons whose boundaries are a subject of extraction.
Evaluated on existing land-use maps, the approach detected 99% of total acreage and loss in the count of fields less than 9%.
However, the authors point out that boundaries of fields close to urban areas were often extracted incorrectly. As a possible post-processing step, they suggested filtering out the urban structures.

Convolutional Neural Network approach
Deep neural networks help to address shortcomings of classical computer vision approaches and can discover more complex patterns. Another research team approached the task of boundary detection using state-of-the-art neural network architecture ResUNet in the paper “Deep learning on edge: extracting field boundaries from satellite images with a convolutional neural network.” An area of main interest was 120,000 square kilometers of South Africa’s “Maize quadrangle.” The authors used regular Sentinel-2, mainly green, blue, red, and near-infrared bands. Not much preprocessing was done on images, but the labeling part was crucial: setting as a purpose to combine both region-based and edge-based detection, researchers labeled field boundaries as one class and entire field area as another.
The results turned out to be quite decent, hitting 90% overall accuracy.
We tried this architecture, but we had single-class boundaries. Also, for a benchmark, we used a few other architectures – original UNet and UNet++. ResNet performed nearly the same as UNet. However, UNet++ performed better than the other two. Perhaps, one more thing also matters: usually, boundaries are visible to the human eye. We supposed it would be evident for an algorithm to discover this pattern. Thus, we used regular red, blue, and green bands, omitting near-infrared. It might be the next step in our pursuits.

Boundary detection with convolutional neural networks for other objects
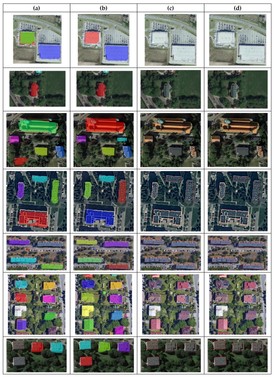
The research team from the Institute of Geospatial Engineering and Geodesy, Poland, approached field boundary detection based on an instance segmentation approach. They have chosen a part of Warsaw and marked objects with class labels as a study area.
The leading architecture to train Mask R-CNN has been selected, supplemented with another “mini-network” pointing where to look for a pattern of interest. Such a network is the Region Proposal Network (RPN), widely applied in object detection tasks of various kinds. Researchers have shown that enhanced Faster Edge Region CNN (FER-CNN) successfully classifies building on satellite images and has a significantly better estimation of boundaries. What is the researchers’ innovation here?
Compared to the original RPN proposed, FER-CNN predicts regions on several resolutions of the feature map. One feature map can be reduced 2, 4, or 8 times, make the region proposal, and we would select those regions where these agree on multiple scales. Compared to conventional algorithms for contour finding, the results show the astonishing precision of the method. Besides great accuracy, they reported a reduced number of mistakes done by occlusions and shadows, which suggests the excellent robustness of the method. The paper Detection, Classification and Boundary Regularization of Buildings in Satellite Imagery Using Faster Edge Region Convolutional Neural Networks describes all details.
Although buildings in the city are not the same objects as fields in the open space, the idea of regularizing boundaries might be viable for the task of interest. The same labeling could be applied to the fields being just one class, or we could combine two tasks at once, field delineation and classification, defining several field types. It is worth a note that the second would require much more time to be spent on the labeling procedure.

Actual challenges and how we might approach them
Despite drastic advances in field boundary detection, there are still issues that can be addressed to improve the accuracy.
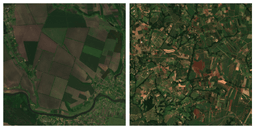
First of all, different locations might have specific peculiarities, making it harder to develop the “one size fits all” approach. As one example encountered in our research, Ukrainian fields are much larger than many other locations. For instance, the difference is striking when comparing local fields to ones in South Africa.

One way to solve it might be to train separate models for different locations or extend the dataset with images from other sites. One way or another, this brings another problem: labeled data. Collecting images is not time and resource-intensive, unlike accurate labeling.
Seasonal changes and the type of crop grown in the field pose a challenge for detection tasks. Even to the naked eye, closely situated fields with grown wheat, for instance, might appear as one large field despite being two parcels. This issue might make a solution less scalable when operating on unseen data. Numerous combinations of composite layers could be obtained from satellite imagery composed of both visible and non-visible spectrums. Some of them might provide meaningful insights and discoveries. For instance, the near-infrared band is widely used for such tasks. However, there is not much literature and reports on the performance of other composites and combinations.

There was also an idea to detect roads and connect them graph-based, as the paper Hierarchical graph-based segmentation for extracting road networks from high-resolution satellite images suggested, and derive field boundaries as a byproduct. This approach did not yield great results. We can find roads everywhere but it is not the same with fields. Also, not all fields and boundaries follow straightforward patterns like regular roads.
Conclusion
Remote sensing technologies allow humanity to automate and scale tasks previously unimaginable. An actual one is field boundary detection, which is vital to several domains. In the past, people tried to automate it with classical computer vision techniques. Since today the computational resources are cheaper than mistakes made by these algorithms, deep learning algorithms are more successful here. Current neural networks being complex systems, yield far better results than their predecessors.
Read more: Field boundaries change detection