Field boundaries change detection

Michael Yushchuk
Head of Data Science
The importance of land-use statistics is undeniable in modern farming and business. Accurate and up-to-date mapping of land usage requires precise land classification, which is complicated without field boundary detection.
Usually, existing maps are based on historic administrative maps or manually developed based on observational data. The first ones do not stand up to high accuracy. The other involves significant amounts of manual labor that increase dramatically with the number of maps to be created or updated. Neither of these survives the scrutiny of variability with time. In such circumstances, yield predictions will not produce accurate estimations, resulting in shortages or disrupting particular goods markets.
We decided to study the probability of detecting boundary changes and the reasons behind them. The changes in the land boundaries can reveal the degradation and improvement of various aspects of agricultural management.
Data
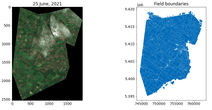
We decided to analyze changes in field boundaries in Kharkiv Region, Ukraine. We have chosen an area of 3161,357 km² with around 13k fields for analysis.
This area is located at the junction of several tiles of Sentinel-2 satellite: 36UYV, 37UCP, 37UDQ, 37UCQ, 36UYU, 36UXA.
For field boundary change detection, we used satellite images and processed them using SoilMate – our handy web application for land usage analysis. Using artificial intelligence and neural networks, SoilMate can detect agricultural lands in large areas, define field boundaries, crop type, yield growth anomalies, plant stress, and calculate their area.
In our case, SoilMate solves the main task of field boundaries detection for the last 4 years from 2018 to 2021.
Field boundary detection
The first task was detecting the selected area’s field boundaries. For that, we loaded GeoJson with the required AoI to SoilMate, then used the Plot Boundaries option and received GeoJSON with geometries for all the fields on the selected area.

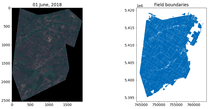

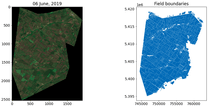

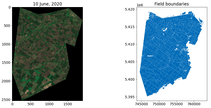

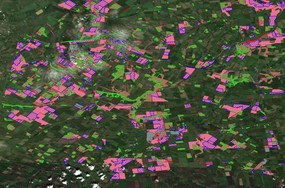
Neural networks conducted boundary detection. As you can see on Figure 1, the fields in the area of investigation change their shapes each year. There are two possible reasons for that:
- the observed field is split into smaller chunks each year
- a more diverse crop is grown within the same field, which the neural network mistook for separate fields
Analysis

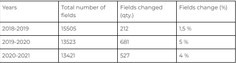
Now, we needed to look for changes in field boundaries for each year. As a result, we got 3-time intervals containing changes (Table 1).

Here are some figures showing changes for each year (Figure 3, a-c)

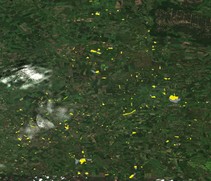

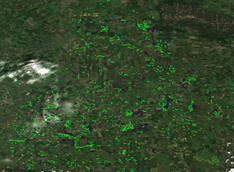

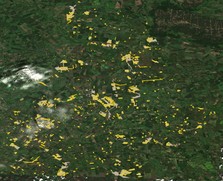
Figure 3. Changes in field boundaries (a) 2018 – 2019, (b) 2019 – 2020, (c) 2020 – 2021
Examples of field changes in the area of interest in the Kharkiv Region are demonstrated below (Figure 4).

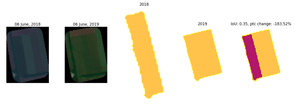

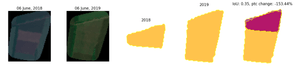

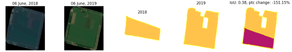


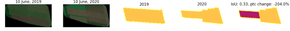

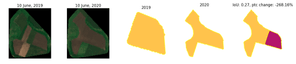

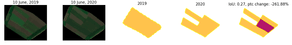

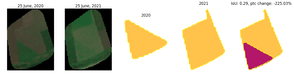

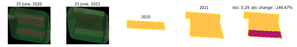

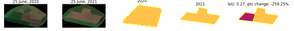
In Figure 4, some changes in field boundaries occurred at the turn of the years. In the last column, you can see those fields’ overlap and real changes in the first two images.
As you can see, the fields’ boundaries do not change. However, some changes still occurred. Farmers’ land usage differs yearly, so it may seem like a change in field boundaries. For some reason, farmers sometimes use only part of a field to grow their crops, skip part of the land, or plant fields with different crops at different times, which can be taken for a change in field boundaries.
Conclusion
Consequently, our field boundary analysis in the Kharkiv region shows that field boundaries do not change over the years. Still, such changes as crop type and growth periods may not only be visible on satellite imagery but also be detected as a change in field boundaries.
Insights:
- SoilMate can be used to derive information regarding field boundaries within the AoI for a certain period.
- Field boundaries in the Kharkiv region remain the same.
- In the area of interest, farmers sometimes plant different crops on the same field and/or at different times.