4 Types of Data Analysis that Improve Decision-Making

Anastasiia Dolgaryeva
Delivery Manager
Your company collects tons of data but you still don’t know how to harness its power for improved business efficiency? Well, it seems like “data-driven decision-making” has become a buzzword used almost as often as “digital transformation.” True, almost everyone, from retail companies to agricultural manufacturers, strives to make data-backed decisions and establish continuous data analysis processes. But what kind of data should they gather? And how can businesses make the most of it?
This article outlines four main types of data analysis and explains how they can help you manage a business in a smarter way.
The major types of data analytics

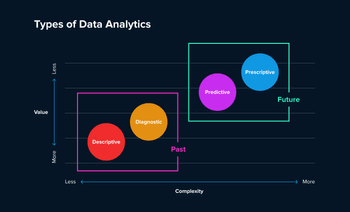
Think of each type of data analytics as a specific tool for solving a particular task. If you need to find the cause of a problem or predict what will happen in a set business area, the types of data analysis methods you choose are critical.
For instance, when you want to see what trends occurred in your business in the last quarter and find the data-backed explanation for them, descriptive and diagnostic analytics will come in handy. But if you want to build a strategy or even shape the future of your business, predictive and prescriptive analytics will do the trick.
Let’s discuss these methods in detail.
Descriptive analytics
Out of the different types of analytics, descriptive analysis is the simplest and the most straightforward way to get insights from the raw data. It answers the “what happened” question using techniques like metrics reports, summary statistics, data aggregation, data mining, and clustering.
Descriptive analytics examples may include any report containing qualitative or quantitative data, data queries, descriptive statistics, or data dashboards. This method is frequently used in different business areas, especially in sales, marketing, and finance departments.
Think of an e-commerce store owner who wants to know what products were the least popular in California during the Christmas season. By applying descriptive analysis to the historical data, she can get information on what items people were least willing to buy in that period. This type of analysis can also provide the overall picture of sales, showing how the store was performing in general.
Reports based on a descriptive analysis are often the products of routine decision analytics practices.
Diagnostic analytics
While descriptive analytics shows us what happened, diagnostic analysis answers the question of why it happened by seeking a cause-and-effect relationship. It provides a broader perspective and insights received after the descriptive analysis.
With diagnostic analytics, you can quickly identify patterns and outliers in your data to find how different factors relate to each other. This type of analytics may include likelihood, probability, or a distributed outcome. It implies such techniques as regression analysis, principal component analysis, and sensitivity analysis.
Since this type of analysis helps businesses find interconnections between data points, it can be used in various cases. For instance, marketing departments can apply diagnostic analytics to define why some campaigns are more effective than others. It can also help logistics providers determine the bottlenecks in routes. In general, diagnostic analytics is a versatile method, and it can cater to different business needs.
Predictive analytics
Predictive analysis uses historical or current data to forecast potential outcomes. For most companies, this is where the “magic” happens. Predictive analysis is more complex than descriptive and diagnostic analysis and always requires data scientists’ expertise. Simply put, this method uses statistical modeling to generate proven forecasts. It may include the following:
Predictive modeling. It is all about using quantitative analysis of data to find patterns. By feeding your data to a predictive model, you can get probable outcomes of a certain decision, for example, changing some elements in a business process.
Time series data mining. It collects organized data (e.g., weather records) over time to extract and discover patterns and make forecasts based on them. The simplest example is defining what time of year a company should expect a spike in demand for products or services it sells.
Bayesian analysis. It is a statistical model that helps to reduce uncertainty by determining the probability of a hypothesis (e.g., the probability of the change of interest rates that affects stock market indexes).
One excellent example of predictive analytics used successfully in business is Vodafone. Their Netherlands division decided to offer special deals on plans and roaming to the clients who were most likely to go skiing. To define those clients, Vodafone’s analysts built a predictive model trained on the data of the people who had been using their phones at major ski resorts throughout Europe in the past.
This helped Vodafone predict who might go skiing that season. But most importantly, they offered targeted services users were more likely to purchase and enjoy without wasting their marketing efforts on the people who won’t find this relevant.
Predictive analytics examples may also include sales forecasting, risk assessment, customer segmentation, etc. But to provide reliable results, predictive analytics needs qualitative and detailed data.

Prescriptive analytics
The prescriptive analysis defines the steps a company needs to take to achieve the desired result. It is based on predictive analytics but supplements its outcomes with recommendations for the future. In other words, this type of analytics answers the question “How to make something happen?” providing decision-makers with the optimal action plan. On top of that, prescriptive models often contain mechanisms that constantly learn from user feedback and adjust the output based on new information.
Prescriptive analytics may include techniques like:
Monte Carlo simulation. It is a method of performing risk analysis by substituting random variables in a simulation to identify how unexpected events might affect the outcomes. It is widely applied in the finance sectors to mitigate risks related to the reduction in the value of investment portfolios.
Recommender systems. This is an information filtering system that strives to predict a set of actions that will increase the chances of beneficial outcomes. For example, most products you see in the “Recommended for your” category of various marketplaces are the results of the algorithms applied by recommender systems.
Speaking of recommendations, Netflix took them to the next level. As you know, the company not only streams but also makes original shows. And when it comes to filming, you can’t afford to make a show anyone will watch. This is where prescriptive analytics comes into play.
In 2021, Netflix has over 203 million subscribers, and the amount of data they’re generating is staggering. What shows were watched most, what episodes or moments were rewatched often, and even whether viewers watched shows till the last episode or dropped it – every detail is gathered and stored to be analyzed.
Thanks to prescriptive analysis, Netflix can tell what its original shows need to have to become a hit. And data doesn’t lie. That’s one of the reasons 93% of their original series have been renewed. Indeed, Netflix doesn’t make shows that producers think might be good; it makes shows that data models promise viewers will love.
With prescriptive analysis, decision-makers can also prevent fraud and define the steps to meet business goals or get a competitive advantage. For instance, airline companies can constantly adjust ticket prices depending on ever-changing factors like weather conditions, fuel prices, and customer demand.
Sounds complicated, doesn’t it? That is why analytics is the realm of seasoned data science professionals.
Beyond the four types of business analytics
Every type of data analytics is intertwined with the others in the data analysis cycle. The latter gives businesses answers to questions like what happened, why it happened, what could happen next, and how to make something happen.
By using descriptive and diagnostic analysis techniques, you can clearly understand what brought you to the current state. Meanwhile, predictive or prescriptive techniques will provide you with a clear vision of future perspectives.
However, applying the four types of business analytics from time to time is not enough to establish data-driven processes. You also need to use business intelligence practices and effective data visualization. Only when all these elements work together can a business grow faster, achieve higher objectives, and avoid the major roadblocks down the road.
And these are not just empty statements. The Quantum team has already helped many businesses leverage their data and get valuable insights from it.
For example, one of our clients is a provider of intelligent returns services that works with numerous retailers worldwide, including ASOS, GymShark, and Missguided. The company needed a web solution that would help it effectively handle all the terabytes of data it possesses. To meet the client’s requirements, our team built a comprehensive data analytics and visualization system that does the following:
- obtains data from third-party databases, organizes it per specific requirements, and stores it
- allows end-users to access the data via a user-friendly web interface, apply different filters to it, and perform calculations
- shows the results on dashboards in different data visualization formats
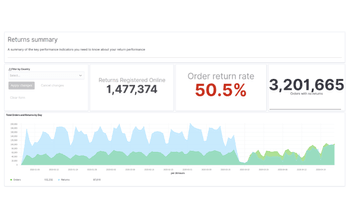
The above data-driven process improved the client’s productivity and took the quality of its services to the next level.
If you also need help with any of the different types of data analysis, Quantum is glad to help.
Data Engineering Services
We run the full analytics lifecycle, from data aggregation and cleaning to creating visual analytics tools to help businesses make smarter, data-informed decisions.
Check the service