Insights Dashboard to Improve Returns Experience in Retail
- #Business Process Automation
- #Data analytics
- #Web development
About the Client
The company offers intelligent returns experience for retailers worldwide through a simplified and reliable return process. Among their clients are such retail shops as ASOS, GymShark, Missguided, and many more.
Business Challenge
The client aimed to give customers a convenient way to visualize business KPIs of order returns quickly, flexibly, and informatively.
Given the limitations to storing and operating user data due to the legal and technical restrictions, it was vital for the business to establish a data obtaining process and configure internal storage with an easy-to-use interface and data analytics visualization dashboards.
Solution Overview
The client reached us to create a web service that analyzes customer satisfaction and provides advice on improving retailers’ return business processes.
The developed solution consisted of 2 related logical units:
- Service responsible for migration and further transformation of initial client data from the third-party DB to an on-site storage as a basis.
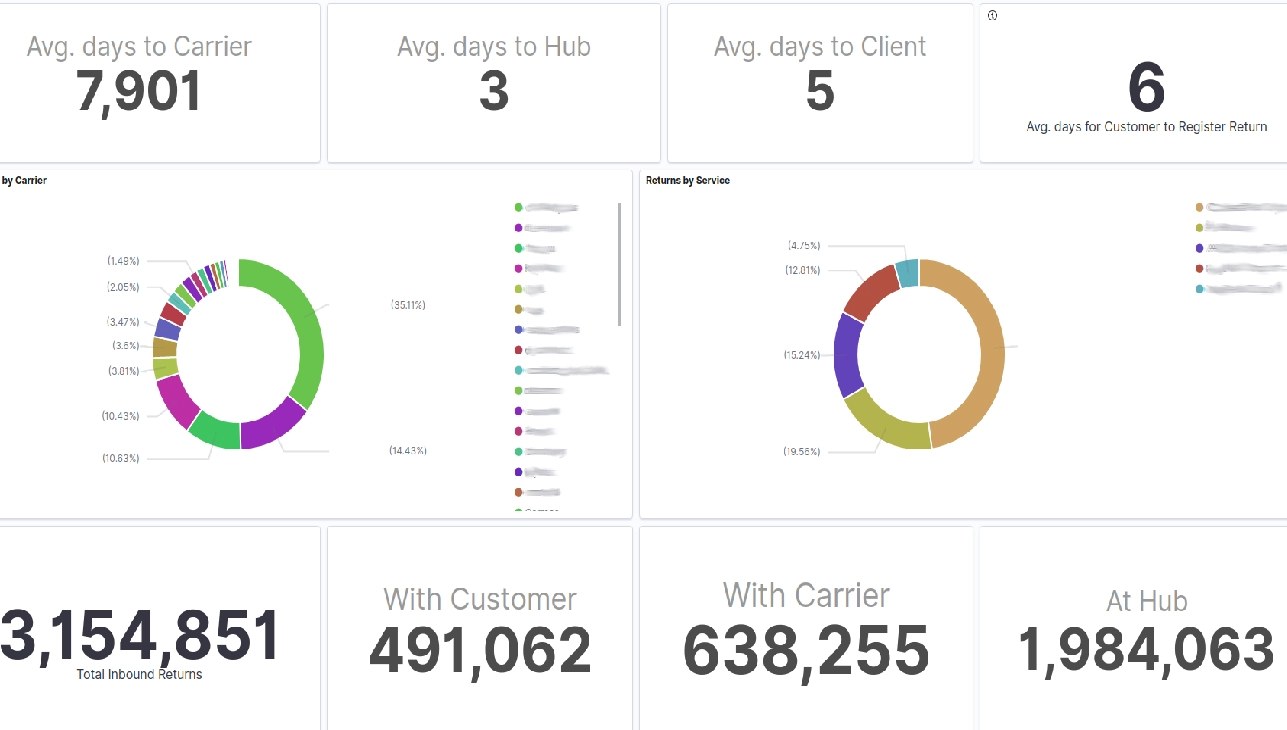
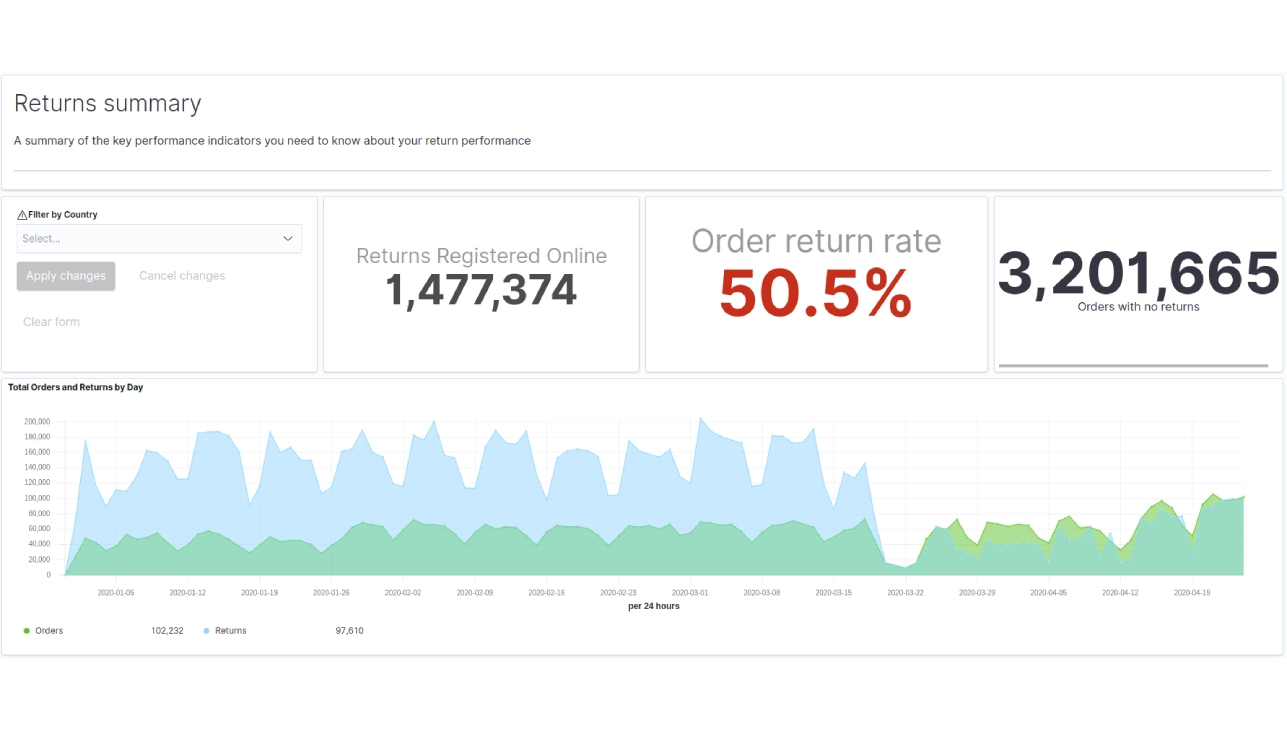
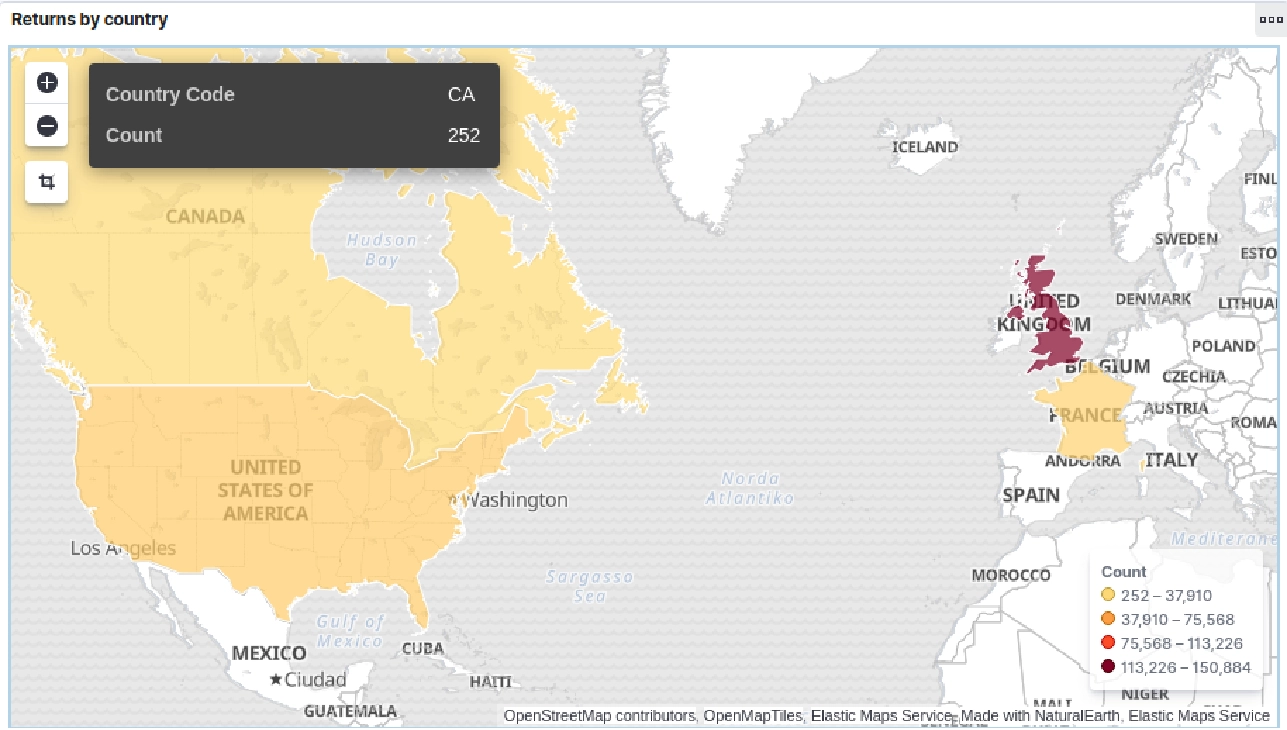
- The web user interface connected to internal storage that uses the stored data to visualize business metrics on dashboards.
Project Description
Since the client possesses terabytes of data, we should develop a persistent system that could easily extract this data and prepare it for further usage. With the help of a data migration service that downloads data from the third-party DB (MySQL) and makes the required transformations, we uploaded the data to local data storage. We organized it to suit clients’ business goals and provided fast and flexible access to a web interface.
The web interface offers the following functionality:
- Data filtering by date and time range, country, service, etc.
- Data export
- Different data visualization formats (bar charts, line plots, pie plots, and others)
- Creation of custom metric calculations and visualizations
- Fast on-the-fly calculations
Let's discuss your idea!
Technological Details
The clients’ requirements were to use the ElasticSearch as a data storage. Therefore we selected the following stack of technologies:
- ElasticSearch – the client selected in-site data storage with predefined settings since it offers speedy search and data aggregation, scaling functionality as well as role-based access control functionality
- LogStash and Kibana – pipeline construction service and a web UI, respectively. Since ElasticSearch was a main requirement of the project, we decided to use all ELK stack (ElasticSearch, LogStash, Kibana) because of the following:
- All 3 services are designed to support easy integration with each other
- Developed by one company (elastic.co)
- Meets the project requirements


