Tracking Experiments with MLflow

Aleksandr Dolgaryev
CTO
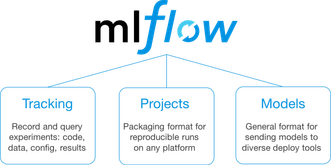
If you’re serious about your machine learning experiments, you’ll need a tool to track and manage them. I personally prefer MLflow. It’s a platform that streamlines machine learning development by tracking experiments, packaging code into reproducible runs, sharing, and deploying models. It’s open-source, lightweight, and offers tons of integrations. That’s why I’d like to introduce you to the MLflow Tracking module and help you get it up and running in your data science project.

Why you need an ML experiment tracking tool
Before we get down to the nitty-gritty of tracking experiments with MLflow, allow me to clarify when tracking is critical:
- When the project is long-term and/or has a lot of experiments in it
- When the project is likely to be prolonged, and you want to have all parameters and metrics stored in a single place
- When the development team has more than one data science engineer, they need an easy way to compare results
Do any of these sound like your case? Then let’s dive in.
MLflow tutorial: Getting started
Installation
First of all, you’ll need to Install MLflow and scikit-learn. To do this, simply run
pip install mlflow[extras]from your working environment. Poof – and you’re ready to start experimenting.
Running examples
I suggest running some examples to see if the installation worked and if MLflow is ready to be added to your pipeline. You can clone the MLflow repository via
git clone https://github.com/mlflow/mlflowThen go to the Examples folder and select whichever feels appropriate. I chose an example from the MLflow tutorial located at
examples/sklearn_elasticnet_wine/train.pyHere:
with mlflow.start_run():
        lr = ElasticNet(alpha=alpha, l1_ratio=l1_ratio, random_state=42)
        lr.fit(train_x, train_y)

        predicted_qualities = lr.predict(test_x)

        (rmse, mae, r2) = eval_metrics(test_y, predicted_qualities)

        print("Elasticnet model (alpha=%f, l1_ratio=%f):" % (alpha, l1_ratio))
        print("  RMSE: %s" % rmse)
        print("  MAE: %s" % mae)
        print("  R2: %s" % r2)

        mlflow.log_param("alpha", alpha)
        mlflow.log_param("l1_ratio", l1_ratio)
        mlflow.log_metric("rmse", rmse)
        mlflow.log_metric("r2", r2)
        mlflow.log_metric("mae", mae)

        tracking_url_type_store = urlparse(mlflow.get_tracking_uri()).scheme

        # Model registry does not work with file store
        if tracking_url_type_store != "file":

            # Register the model
            # There are other ways to use the Model Registry, which depend on the use case,
            # please refer to the doc for more information:
            # https://mlflow.org/docs/latest/model-registry.html#api-workflow
            mlflow.sklearn.log_model(lr, "model", registered_model_name="ElasticnetWineModel")
        else:
            mlflow.sklearn.log_model(lr, "model")
Adding MLflow to your pipeline
Tracking experiments
There are various things you can track using MLflow Tracking:
- Parameters. Something you put into your pipeline, such as loss function type, number of epochs, image size, and learning rate.
- Metrics. Accuracy, cross-entropy, IoU, etc.
- Artifacts. Images or files you’d like to attach to the run, e.g., graphs, data (CSV files, training image samples).
import mlflow

# Set the server URI if you NOT tracking locally
# If running locally - skip this step
remote_server_uri = "..."
mlflow.set_tracking_uri(remote_server_uri)

# If the experiment under the given name already exists - get it's ID, else - create a new experiment
try:
    experiment_id = mlflow.create_experiment(name=args.exp_name)
except:
    experiment_id = mlflow.get_experiment_by_name(name=args.exp_name).experiment_id

# Run name is a string that does not have to be unique
mlflow_run = mlflow.start_run(experiment_id=experiment_id, run_name=args.run_name)

with mlflow_run:
    mlflow.log_param("epochs", str(args.epochs))
    mlflow.log_param("batch_size", str(args.batch_size))
    mlflow.log_artifact(local_path='local/path/to/artifact')
    if args.seed:
        mlflow.log_param("seed", str(args.seed))
Comparing experiments
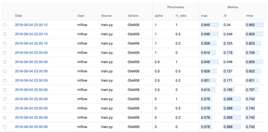
You can use the MLflow Tracking module to compare the models that have been trained. MLflow creates a mlruns folder in the working directory with all of the experiments saved into files. You can inspect them using a convenient UI module. Simply run
mlflow uifrom your working directory and here is what you’ll see:

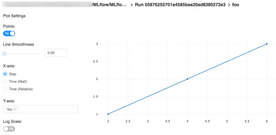
If you want to inspect a specific run, click on it and the details will show up:

Creating a Keras callback
There is a neat way to track metrics using MLflow. Below is an example of a Keras callback that will log your model’s intermediate results: train and validation loss/accuracy (or any metric you add to the model). It will also log the best model with MLflow at the end of the training process.
class MLflowLogger(Callback):
    """
    Keras callback for logging metrics and final model with MLflow.
    Metrics are logged after every epoch. The logger keeps track of the best model based on the
    validation metric. At the end of the training, the best model is logged with MLflow.
    """
    def __init__(self, model, **kwargs):
        self._model = model
        self._best_val_loss = math.inf
        self._pyfunc_params = kwargs
        self._best_weights = None
    def on_epoch_end(self, epoch, logs=None):
        """
        Log Keras metrics with MLflow. Update the best model if the model improved on the validation
        data.
        """
        if not logs:
            return
        for name, value in logs.items():
            if name.startswith("val_"):
                name = "valid_" + name[4:]
            else:
                name = "train_" + name
            mlflow.log_metric(name, value)
        val_loss = logs["val_loss"]
        if val_loss < self._best_val_loss:
            # Save the "best" weights
            self._best_val_loss = val_loss
            self._best_weights = [x.copy() for x in self._model.get_weights()]
    def on_train_end(self, *args, **kwargs):
        """
        Log the best model with MLflow and evaluate it on the train and validation data so that the
        metrics stored with MLflow reflect the logged model.
        """
        self._model.set_weights(self._best_weights)
        log_model(keras_model=self._model, **self._pyfunc_params)
Saving to cloud
All experiments are logged locally by default. But what if you have a team of specialists and want to share and compare your results with theirs? There are ways to store and track them in remote storage. For instance, you can launch a tracking server on a remote machine or log in to Databricks Community Edition.
Create an EC2 instance
Follow these simple steps to create a micro instance with allowed inbound SSH traffic and TCP traffic on port 5000. This port will be used when setting the tracking URI in the code.

Run the tracking server on the instance
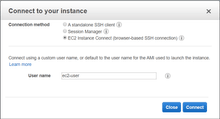
Connect to the instance using AWS Console: in the EC2 instances list, choose the instance, click Connect, and choose EC2 Instance Connect. It will take you to the console view.

Now, in the console, install all dependencies:
sudo yum update -y
sudo yum install -y python3.7
sudo pip3 install mlflow psycopg2-binary boto3

sudo mkdir -p /mnt/mlflow/params-metrics
sudo chmod -R a+rwx /mnt/mlflow
mlflow server --backend-store-uri /mnt/mlflow/params-metrics --host 0.0.0.0
Log experiments and view the results
You have a remote server up and running – you only need to track your experiments to it. You can find your instance’s IPv4 address in the EC2 Instance list. Set the tracking URL in your code to
http://<ip-address-of-your-ec2-instance>:5000and you’re ready to go. Open the same link in your browser, and you’ll see the UI of the tracked experiments.
Advanced remote server usage
If you want to step up your game, save parameters and metrics to a database, and store the saved artifacts in an S3 bucket, there is a solution. You need to create an S3 bucket and an RDS database in AWS, configure the IAM role, for instance, and launch the MLflow tracking server.
Autolog (experimental)
There is an experimental auto-logging feature in MLflow. It allows tracking all parameters, metrics, and models without explicitly stating it in the code. There are several currently supported frameworks and libraries:
- TensorFlow and Keras
- Gluon
- XGBoost
- LightGBM
- Spark
All you need to do is call
mlflow.FRAMEWORK.autolog()before training, and MLflow takes care of the rest. This function hasn’t been tested by our team yet, but you can go ahead and try it out yourself.
Summary
I truly hope that my MLflow tutorial will help you set up MLflow Tracking so that you can track your data science experiments. For even more info on MLflow, go to MLflow Github or MLflow docs, and subscribe to the updates of Quantum’s R&D blog!