Sentinel-2 and PlanetScope imageries for Deforestation Detection

Michael Yushchuk
Head of Data Science
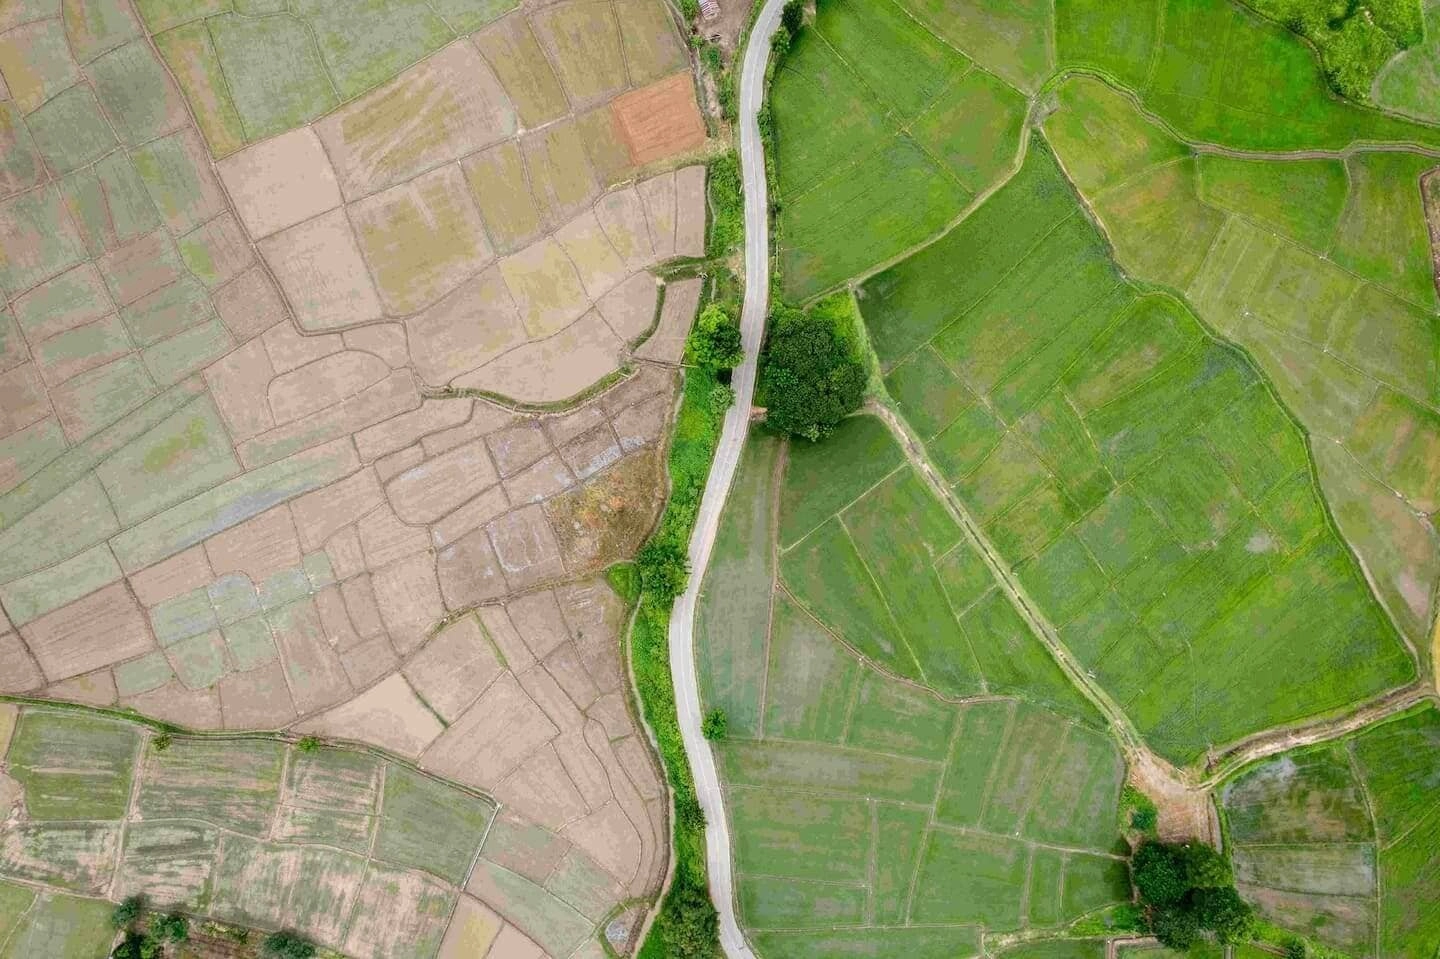
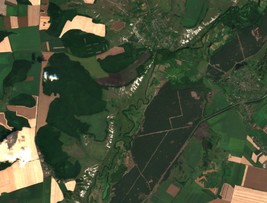
Woodlands in Ukraine, similar to most forests in other countries, are at risk of the associated risks of illegal deforestation. Official statistics of illegal logging in Ukraine show a decrease from 10,000 cases of illegal logging per year to 5,000 for the last 10-year period but independent observations indicate an increase in the number of violations. At the same time, according to state and civilian estimates, the amount of illegal logging is increasing and in 2019 amounted to more than 100,000 cubic meters. Moreover, the largest number of cases of illegal logging and volumes of illegally harvested wood accounted for just the forest-steppe regions of Ukraine and not the mountains.
Effective mechanisms to reduce illegal deforestation include monitoring systems, which are primarily based on remote sensing. To systematically detect clearcuts, we deployed the ClearCut, an open-source service for monitoring logging regions. Nowadays, it uses Sentinel-2 imagery as the data source for clearcut detection.
But assuming the spatial-temporal resolution of the Sentinel-2 mission (10 meters per pixel and 5 days revisit time), the imagery from PlanetScope seems to be a very promising platform for forest change monitoring by virtue of its very high spatial and temporal resolution. Thus, within this project, we aim at specifying the quality of deforestation detection with PlanetScope data and comparing the segmentation quality with Sentinel-2 data.
We manually created a dataset of clearcuts using PlanetScope data. Then we performed the matching between PlanetScope and Sentinel-2 tiles. After data preparation, we performed forest change detection with a deep learning model on the created dataset but using two sources of imaging data: PlanetScope and Sentinel-2. In the result, we show that PlanetScope imagery provides a higher quality of segmentation (F1-score equals 0.52 versus 0.37, drawn from the Sentinel-2 data), and thus could be used as a potential platform to detect logging regions. Collecting large PlanetScope datasets with high spatial and temporal resolutions will give an opportunity to monitor forest change detection with a quality higher than that which Sentinel-2 imagery could provide.
Data and Methods
Imaging data
As the sources of imaging data, we used Sentinel-2 and PlanetScope imagery. The comparison of spatial-temporal-spectral information is given in Table 1.

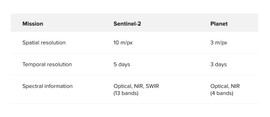
As for the data from Sentinel-2, we used Level-A optical (True Color Image, B02, B03, B04 bands) images. From the PlanetScope, we used Analytic products in the optical wavelength range (RGB bands). Both Sentinel-2 and PlanetScope sources of data include NIR information, but our experiments showed no improvement after adding NIR bands into the analysis.
Labeling procedure
At the start, we decided to use available Sentinel-2-based labeling, but the analysis showed that we could not use it for our problem. Available PlanetScope data covers a different date range. Thus, our experiment requires the collection of a new set of labels. Furthermore, this new label set had to have as large a number of matching images as possible in both available PlanetScope and Sentinel-2 imagery.
Thus, based on the PlanetScope data, we collected and assembled the new dataset of clearcuts. The dataset of clearcuts was drawn from the 100 PlanetScope tiles, overlapped in time and space with Sentinel-2 tiles. These regions cover some forest regions of Ukraine (Kharkiv region) and were observed by PlanetScope during 2016-10-02 and 2019-10-31. Within these tiles, we found and manually labeled 212 deforestation events. These events were observed within different 150 clearcutting regions.
Deforestation detection approach
To detect clearcutting regions, we compare two images, separated by time, and highlight the pixels at which the new clearcuts appeared. This problem is known as image segmentation. We solved it using the deep learning UNet model.
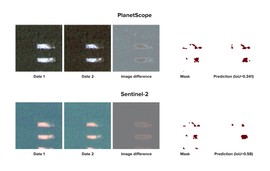
To create a training dataset, we retrieved the small images around each clearcut (see Figure 1) and segmented the deforestation events by comparing the pieces, separated by time, of the same clearcuts.

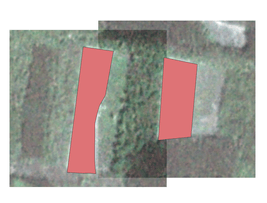
PlanetScope. We cropped on each tile the 168×168 px region (504×504 meters) around each clearcut. Images for each clearcut were compared at different dates (up to 30 days of time intervals). As a result, we received 1,042 pieces of data (798, 132, 112 in training, validation, and testing splits, respectively). Only 139 masks of logging were included in the pieces. As we mentioned previously, the images include three optical channels.
Sentinel-2. We cropped around each clearcut the 56×56 px region (560×560 meters). To prevent the creation of redundant crops, we truncated the Sentinel-2 tiles with PlanetScope tiles geometries. This step was done to align Sentinel-2 tiles with corresponding (in time and space) PlanetScope tiles. Images for each clearcut were compared at different dates (up to 30 days of time intervals). As a result, we received 1,042 pieces of data (798, 132, 112 in training, validation, and testing splits, respectively). Only 139 masks of logging were included in the pieces. The images include three optical channels.
Our procedure of dataset creation guarantees that during training the segmentation model, as well as during the testing of it, we will compare the same clearcuts (in time and space) for both sources of images. The only difference between these two datasets is in the used source of imagery (PlanetScope and Sentinel-2).
Segmentation quality metrics
As the accuracy metrics, we used the following scoring functions, which compare the ground truth mask of clearcut, and the mask predicted by a model.

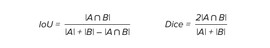
Also, we use the metric, which represents the quality of clearcut detection (but not actual segmentation). To calculate this metric, one has to set a threshold on the IoU score and count the number of deforestation regions, which were segmented correctly and incorrectly assuming the segmentation quality threshold. These numbers represent the types of detections, namely True Positives (ground truth mask has clearcut, and the model predicts it with IoU larger than a threshold), False Positives (there is no clearcut in ground truth mask, but the model predicts the unreal deforestation event), and False Negatives (ground truth mask has clearcut, but the model could not detect it with IoU larger than a threshold).

where TP, FP, FN stand for the number of correctly (TP) and incorrectly detected (FP, FN) instances.
Results and Conclusions
We trained the deep learning model and applied it to the datasets. In result, we obtained the following scores on the validation dataset (see Table 2):

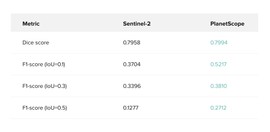
PlanetScope provides higher values of the Dice score and F1-scores for different IoU thresholds than Sentinel-2. The fact that we have almost equal Dice scores means that we segment clearcuts almost equally within both datasets. But F1-scores show that PlanetScope provides tighter predictions to the ground truth masks because with this imagery, we obtain a larger number of TP and a smaller number of FP+FN with set IoU thresholds than with Sentinel-2. Thus, we could detect clearcuts with PlanetScope more confidently.
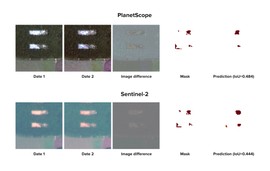
As we can see from the visual comparison of predictions (Figure 3-4), we could infer clearcuts with a larger segmentation quality and obtain smoother predictions with PlanetScope data.

Thus, we can conclude that PlanetScope is a great platform for monitoring deforestation regions within ClearCut service. Its spatial resolution allows us to receive better detection quality, and assuming its high temporal resolution, using PlanetScore data, we could detect clearcut precisely with a very high frequency. We believe that further improvements to the model, which is a basis of the ClearCut service, could be made by extending the training sample of clearcuts, as well as by adding more PlanetScope data.
The article was written by Mikhail Yushchuk and Sergiy Slipushenko.