How to detect stressed plants before it’s too late

Michael Yushchuk
Head of Data Science
As the human population grows, the efficiency of agriculture becomes a crucial issue. Even though it is noticeably different from what it was decades ago, crop production still can and will be improved, given a pressing need for food security and active research in agriculture. A simple approach of sowing larger areas with crops is not only an expensive endeavor but also comes with undesirable consequences, such as natural habitat destruction, soil degradation, and simply limited area that can be utilized for agricultural purposes.
A better deal with this problem is minimizing crop losses in the existing fields. There are numerous harsh conditions to which plants can be subjected during their growth which usually results in plants’ premature death or growth anomalies.
The first method used to fight crop loss due to these stresses is genetic modification of the crop (known as GMO – Genetically Modified Organisms) in a way that makes a plant stress-resistant. However, GMO technology is not a panacea to all agricultural challenges and has its challenges and drawbacks.
All concerns mentioned above leave the best option: early detection and fighting a particular stressor. Monitoring can also be done on different scales and levels. The most scalable and cost-effective ones are the use of satellite imagery and the use of UAVs (Unmanned Aerial Vehicles). However, using in-field sensors might get costly and troublesome, especially on a large scale.
Different stresses and their sources
Plant stresses are usually divided into biotic (stress resulting from exposure and interactions with other living organisms) and abiotic (stress arising from environmental conditions and characteristics).
Biotic stresses can involve exposure to viruses, fungi, or bacteria that can cause severe disease or prevent natural plant growth due to exposure to parasites. Competing plants might also pose issues in plant development, depriving them of nutrients and water.
Among abiotic stressors, plants can be subjected to temperature extremes and droughts. Water availability is undeniably the most critical factor as it is used by plants for nutrient transportation and serves as a precursor for energy storage in the form of glucose. The temperature extremes can negatively damage a plant’s protective cover, impacting the normal process of photosynthesis.
Chemical characteristics and composition are also crucial for healthy vegetation to develop. Moreover, one soil might be more suitable for one crop but not the other purely because of such characteristics.
The most accurate assessment: laboratory tests. Pros and cons.
Laboratory tests are usually used for high-quality checks if a plant is subjected to one stressor. Determining chemicals in the soil or plant can be known with high precision in laboratory settings. If there is any biotic stressor, it can be determined which insect, fungus, or bacterial species is the main danger for the crop. These are certainly pros.
What about the cons?
Laboratory tests are disruptive, meaning one has to physically remove a plant to test it, remove a portion of the soil, or anything subjected to the test for that matter. Another issue with “in situ” tests is the inability to scale; the procedures of tests are usually expensive and time-consuming, while the test results generally apply to a small population or area.
Undoubtedly, obtaining a sample from the soil is a good idea and accurately assessing all needed attributes once or twice per season. But for intermediate monitoring, it is not a suitable choice.
Methods of monitoring and assessment with remote sensing
Visible and infrared light interact differently with matter, depending on its chemical content and structure. Different specters can be combined into reflectance indices to create an even more informative picture.
The most important one is the Normalized Difference Vegetation Index (1). A healthy plant during warm seasons of blooming reflects a large portion of near-infrared radiation, pushing such a ratio closer to 1, write the opposite is true when the plant is affected by stressors. Normalized Difference Moisture Index (2) is a similar index that helps to estimate crop water stress levels. Normalized Difference Red Edge (3) is usually correlated with nitrogen content in plants’ stomata. There are a lot of other spectral indices to go through, each of which might provide some aspect of plant stress regarding one or several problems. An example of the indices above, along with the corresponding RGB image, is shown in figure 1.

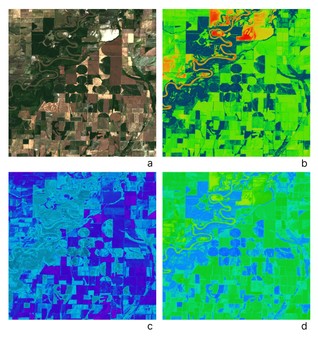

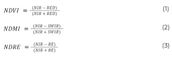
NIR – reflection in the near-infrared spectrum (785-899 nm),
RED – reflection in the red range spectrum (650-680 nm),
SWIR – reflection in the short-wave infrared spectrum (1565-1655 nm),
RE – reflection in the near-infrared spectrum (698-713 nm).
Hyperspectral imaging
Hyperspectral imaging allows for the obtaining of detailed information regarding reflected waves. It deserves a separate imaging category due to its narrow range of wavelength binning. For comparison, Sentinel-2 mission satellites have 13 bands ranging from 458 nm wavelength up to 2280 nm, while Earth Observer-1 (EO-1) Hyperion Mission provides images with wavelengths from 357 to 2576 nm binned in 220 separate channels.
Not only do satellites provide such data, but UAVs are also widely equipped with sensors of different kinds and used for hyperspectral imaging. Such data might be valuable for agricultural applications.
Thermal imaging
Despite being a great source of information about waves’ interaction with plants’ leaves and soil surface molecules, even infrared imaging cannot accurately estimate one critical aspect in plant stress assessment: temperature. A great deal of research has been spent proposing several spectral indices that take into account temperature data besides the usual visible or infrared radiation data, such as the Crop Water-Stress Index (CWSI), which usually performs better in water content estimations.
Fluorescence imaging
Just like molecules’ interaction with waves of infrared wavelengths has a unique signature, waves in the ultraviolet range help to conclude the chemical and physical properties of plants and soils. Fluorescent images have been proven helpful in early crop disease detection, heavy metal content, and soil salinity estimation. Ironically, a laboratory test for chlorophyll content estimation is a similar procedure known as spectroscopy. This value is rarely derived from other tests, such as chemical reactions to dioxane.
Stresses forecasting
Physical [empirical] models
Many processes have been modeled biologically, chemically, and physically to determine different indicators of plant stress. Photosynthesis is modeled chemically with the C4 photosynthesis model, stomatal conductance is estimated with the Ball-Berry model (4), and the list goes on. In the Ball-Berry model, g is the stomatal conductance for CO2 diffusion, An is the net leaf CO2 assimilation rate, Ds and cs are the vapor pressure deficit and CO2 concentration at the leaf surface, respectively, Γ is the CO2 compensation point, g0 is the value of g at the light compensation point, and a1 and D0 are empirical coefficients.


The problem with these models is upfront: there is no way to determine all empirical values needed for these models without being non-disruptive. Also, it does not scale and might not necessarily be generalized to large areas.
Supervised modeling
Large amounts of data gathered from satellite imagery or UAVs inspire research on the junction of agricultural practices and machine learning. Usually, field measurements, records of diseases, and results of chemical and geological tests are used as labels, and numerous efforts were put to model some value of interest.
Works of plant stress modeling and prediction are numerous and have investigated the possibility of droughts, soil salinity, nutrient content, heavy metals content, and other stresses. Commonly, hyperspectral imagery is used as input.
Sometimes, different spectral reflectance indices or several stacked bands are used, and the rarest is regular RGB imagery. Various models, as well, have been deployed to both classical machine learning and deep learning algorithms to produce noticeable results given the non-triviality of the task.
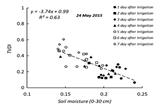
A widely used procedure is described in Relationship Between Field Measurement of Soil Moisture in the Effective Depth of Sugarcane Root Zone and Extracted Indices from Spectral Reflectance of Optical/Thermal Bands of Multispectral Satellite Images. The soil moisture content was determined for five points per each of eight fields using the gravimetric method, resulting in forty ground truth data points. As input data, several spectral indices, including Normalized Difference Vegetation Index (NDVI) and Temperature Vegetation Dryness Index (TVDI), were constructed from the Landsat 8 satellite imagery. As a model, PLSR was used. The research found TVDI to be the most accurate for soil moisture estimation, with a coefficient of determination value of 0.63. An example of a visualized fitted model is presented in figure 2.

Deserves notice the paper Neural Network Approach to Water-Stressed Crops Detection Using Multispectral WorldView-2 Satellite Imagery, which is among the first applications of a Multi-Layer Perceptron to classify the soil under severe water stress, beating previous approaches such as Logistic Regression. In contrast to previous methods, generalization across different soils and crops.
The researchers in the paper Comparison between artificial neural network and partial least squares for online visible and near-infrared spectroscopy measurement of soil organic carbon, pH, and clay content have done extensive work comparing the usually used PLSR model to ANN to model soil organic carbon content, clay content, and soil pH at once. As an input, researchers used spectral imagery ranging from 371 to 2150 nm. The problem with pH is that this characteristic depends on compounds present in the soil but is not directly determined. That research found a better performance of ANN in estimating organic carbon content, clay content, and pH levels.

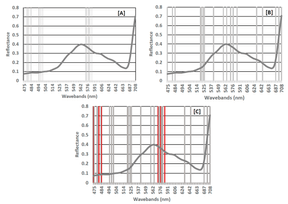
The issue of water stress assessment is reduced to classification in the paper Modelling Water Stress in a Shiraz Vineyard Using Hyperspectral Imaging and Machine Learning. The researchers measured in-field stem water potential values and classified areas with values lower than -0.7 MPa as non-stressed and areas with values higher as stresses. A Random Forest (RF) model and Extreme Gradient Boosting (XGBoost) were trained on hyperspectral imagery. RF produced slightly better test accuracy (81.7% versus 80.0%). One more interesting note is on wavelengths importance which is shown in figure 3. There are several wavelengths at which a valuable signal was considered significant by both models.
Unsupervised modeling
Even though imagery and sensor data are countless, labeled data is the limiting factor for developing supervised models. Sadly there is no easy way to apply unsupervised algorithms to such applications.
One unsupervised approach is used for the preprocessing task when selecting the most informative wavebands. Widely Principal Component Analysis (PCA) discriminates similar bands with little or no new information. In the paper Early Visual Detection of Wheat Stripe Rust Using Visible/Near-Infrared Hyperspectral Imaging, researchers used PCA and successive projections algorithm (SPA) to reduce a hyperspectral signal to just eight key wavelengths in the first case and 12 in the second. Three experiments were conducted, training a feed-forward neural network on each subset of selected wavelengths and the full 256 wavelength spectrum. As concluded by researchers, training a model on the full spectrum did not score better in early plant rust detection.
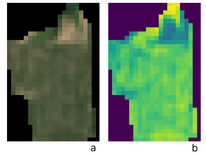
Another technique applied to plant stress detection is described in the paper Inferring Grassland Drought Stress with Unsupervised Learning from Airborne Hyperspectral VNIR Imagery. The authors used Simplex Volume Maximisation, a variant of the matrix factorization algorithm, to identify soils with healthy and stressed water profiles using different water and vegetation indices, including NDVI, Photochemical Reflectance Index (PRI), Modified Chlorophyll Absorption and Reflectance Index (MCARI), and many others. Figure 4 presents an example of their results along with corresponding regular RGB images captured by UAV.

![RGB imagery of study area and derived archetypes [classes]](/_gatsby/image/d26571dbc101db14250f5a7f5ca070b5/d36e4ca88213e8b21aa435fccbd38107/RGB-imagery-of-study-area-and-derived-archetypes-classes.jpg?u=https%3A%2F%2Fwp.quantumobile.com%2Fwp-content%2Fuploads%2F2022%2F08%2FRGB-imagery-of-study-area-and-derived-archetypes-classes.jpg&a=w%3D213%26h%3D194%26fm%3Djpg%26q%3D90&cd=2024-01-11T18%3A33%3A03)
Available data and products
As mentioned before, numerous studies in the field of detection and forecast of plant stresses have been performed on small scales, that is, a few kilometers squared fields or less. Unfortunately, almost none of such datasets are publicized and freely available.
Some data from monitoring stations can be acquired from the National Soil Moisture Network or GEO Department of TU Wien regarding surface soil temperature and soil moisture measures. These are great resources for water and temperature extreme stressors mapping shared generously with researchers and the public.
There are several other sources not precisely of on-ground measures, however, worthy of checking out provided by NASA. For example, the ECOSTRESS Program delivers data on evapotranspiration derived from collected hyperspectral data. The problem is not even the fact it is derived measures but rather limited resolution and period of revisiting.

ISRIC – World Soil Information Portal released a SoilGrids250m platform combining numerous sources regarding soil classification, nitrogen content, and soil organic carbon.
There is no shortage of multispectral data available easily. However, imagery of high resolution is harder to obtain. The best freely available imagery is provided by the Sentinel-2 mission, giving access to 10 m per pixel resolution. Still, even this is far from ideal when defining statistics for an individual area. As shown in figure 5, even on the best resolution of Sentinel-2 imagery individually, fields are crudely pixelated.
Conclusions
Plant stress detection has a growing interest in precision agriculture applications. There are numerous stressors to which crops can be subjected. Accurate laboratory tests provide valuable information regarding plants’ and soils’ status and resilience to harsh conditions, although such data is scarce and hard to collect for early detection.
Much research has been put into the investigation of methods for stress detection using remote sensing techniques, including fluorescent, hyperspectral, multispectral, and thermal imaging. The specific spectral indices were developed to aid the extraction of the needed signal for estimating the value of concern; these indices comprise the data from several reflectance wavelengths.
Machine learning techniques are used to investigate the possibility of discovering an accurate mapping of spectral imagery data to the results of laboratory experiments on soils and plants. The most common techniques are variants of linear regression, and deep neural networks are also starting to catch up. The later models are at least compatible and often better performing.
Despite all advances made, researchers around the globe still struggle to investigate to shorten the time between anomaly detection and actions to address them.
Publicly available data is still limited and hard to collect and process. Only recently, platforms to ease this process and aggregate needed information emerged.
Read more: Quantum in the top 3 winners of the Autonomous Greenhouse Challenge