How to Build a Smart Plant Monitoring System
Sustainability is a key vector of the technological development of the modern world. More and more companies are working with high-tech solutions that apply cutting-edge technologies, such as Artificial Intelligence and Machine Learning, to optimize business processes in a way harmless for the environment. However, there is still a lack of knowledge on how to build an end-to-end pipeline for your particular task and also reduce costs for your farm management.
When investments can bring profit
Greenhouses and other farms hire dozens of gardeners, who monitor plants and their growing conditions. Consequently, the more plants you have, the more staff you need to involve. Exactly for this purpose, to scale the productivity of your business, automated monitoring systems that use machine learning and computer vision as their backbone can dramatically cut expenses.
Due to the dependence of farm income on the level of yield, monitoring of growing conditions and plant disease prevention are key practices to maximize business profit. It is especially valuable for high-cost plants, such as medical cannabis, when you need to quickly treat or remove the affected plants, thus saving around 25% of the crop.
How greenhouses should be equipped
Smart farms require a good technological infrastructure, which may include various sensors that measure temperature, humidity and other parameters. These devices are relatively cheap, however, they capture basic data that is not always informative enough. In contrast, indoor cameras have a number of applications for which they can be used.
Gardners observe most of the data with their eyes, they can determine the growing stages and the general health state of plants based on particular visual symptoms. That is why mounted cameras that constantly monitor a wide area of farms and computer vision techniques can provide the business with a number of insights.
As we said, the main advantage of using cameras is that they allow us to solve a range of tasks and can be applied in many different cases. However, the downside is that cameras have physical limitations due to angle and scale (resolution). Also, complex solutions require high-resolution images and enhanced computational capabilities for better accuracy and performance.
Our solution development pipeline
The goal of our project was to identify signs of illness on the plants, such as yellowish leaves, rash or stains on the leaves, etc. This information would allow the business to automatically monitor the health state of the plants and quickly treat the affected plants.
For this purpose, we developed a multi-staged pipeline that performed segmentation to detect particular leaves or trunks of plants for further health checking. Then we classified particular symptoms on leaves that can be stacked with each other (multi-labeled classification task).
Leaf segmentation model
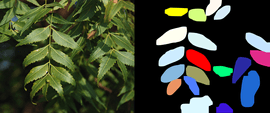
After research, we built and trained the custom Pyramid CNN deep learning model based on the paper to detect leaf contours. We found a public dataset and applied transfer learning on our data to reach more accurate results. It was really helpful because we had a limited number of annotated images from cameras. Then we applied various post-processing methods with OpenCV and Scikit-Image, such as watershed, quickshift, segments merging, and models ensemble, to improve model performance and get results as instance segmentation masks (fig. 1 and 2). On evaluation, our model got an instance segmentation metric (mAP@0.25) between 0.75 and 0.8, so the model performed well at localization of the leaves, but their borders could not be so accurate.


Leaves filtering model
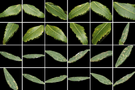
After the image segmentation stage each instance of the leaf had to be retrieved from the source image, cropped, and resized (fig. 3). The main issue at this stage was to filter irrelevant data from the previous stage, so we trained several models for binary classification to extract only leaves that are clearly seen. We faced a problem when images had a resolution that was too low, so it was hard both for the labeling team to create good annotation and for the deep learning model to work with small features. Consequently, we found the optimal image size and applied appropriate preprocessing for extracted leaves. On the evaluation, our model showed an F1-score more than 0.9, which means almost all valuable information was redirected to the following stage.

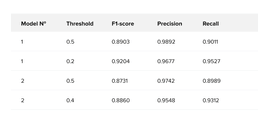
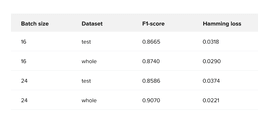
The first model has fewer layers and RandomHorizontalFlip augmentation. The second model has more layers and several transformations (RandomHorizontalFlip, RandomRotation, Normalize). The performance of each model can be checked in Table 1.

Multilabel classification model
1vsAll Classifiers
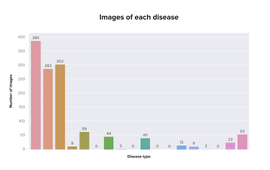
The first approach we tested was to train several 1vsAll binary classifiers. So we prepared individual datasets for each disease type with a proportion of positive and negative samples close to 50:50. The motivation was the imbalanced data where different classes had different numbers of samples. The initial dataset was too imbalanced (fig. 4), so classification cannot be claimed as fair and accurate. A lot of disease classes were almost without samples.

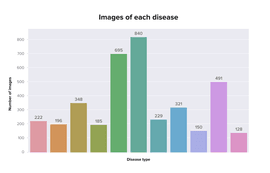
Then we ask the labeling team to annotate more data. Also, they excluded too rare classes or combined them into groups with similar features. They run the segmentation model on a range of images with no automatic filtering to avoid false negatives and manually checked images of leaves. As a result, the dataset (fig. 5) reduced its number of classes from 18 to 11 and increased the total number of image samples by 3 times. An important note is some of the images have duplicates because one image can have more than one label.

In the end, the trained models performed well on subsets with a given distribution of target (about 50:50), and we had accuracy up to 0.9 for most classes, but on the general dataset, the F1-sampled metric was 0.65-0.69 that can be observed on Table 2. Classifiers that showed the worst results had the least number of samples (disease_9) or too common features, which caused false positives predictions (disease_5, disease_8).

Final multilabel classification model
As our final solution, we decided to train a single model with multiple outputs for each class. We divide our updated dataset from the first part of the report to the train-val-test (70-15-15%).
For backbone, we used resnet-50 and efficientnet-b0 (the most lightweight pretrained encoder models). EfficientNet outperformed ResNet, which wasn’t a surprise according to the article with benchmarks. Moreover, we trained the most simple EfficientNet model due to performance limitations, so models with a higher number of parameters, for example, efficientnet-b4, will perform even better.
Also, we excluded rotation augmentation because it had no positive effect on the accuracy, so we used only HorizontalFlip and Normalize transformations.
For better performance, we can set individual thresholds for each class to handle the effect of imbalanced data. So we just run our evaluation with the F1 metric on each class with different thresholds and pick the highest one. This strategy gave a boost in the metric by around 5%.
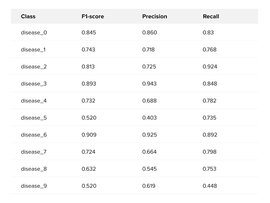
But the most significant impact on the metric score was made by a new loss function. It gave around a 20% boost in F1-score. AsymmetricLossOptimized, in comparison to BCEWithLogitsLoss, works better with imbalanced datasets, which is exactly our case. As a result, the final F1-score metrics can be seen in Table 3.
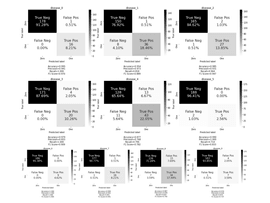
From the confusion matrix (fig. 6) we can see that most misclassifications were made in the next classes: disease_1, disease_4, disease_8 – the biggest classes, so they could be too messy and had too common and generalized features; and disease_9 – had not enough images. Despite all this, the final model was twice better than the baseline and allowed to identify plant diseases with high accuracy.
Conclusions
Computer vision and machine learning technologies open a broad range of different applications that can drive sustainable development. Businesses can greatly benefit from providing these high-tech solutions to their production processes. To prove it, we showed our full solution development pipeline of the project about smart monitoring systems for greenhouses.
As a result, we created a pipeline with the next stages: image segmentation (to find leaves on the source camera shots), leaf processing (to retrieve and filter valuable information for each detected leaf), and disease classification (to detect ill leaves which can have multiple symptoms). In the end, our model worked with 11 classes with an F1-score metric value up to 90%.