Performance issues detection. Python profiling

Aleksandr Dolgaryev
CTO
Every day we face issues with performance, and it is not always clear what leads to bad results in the first place. In this post, I decided to put together possible steps to detect performance problems.
First of all, we need to detect possible causes of low performance. Usually, they are:
- CPU usage;
- GPU usage;
- I/O operations.
Check CPU usage
Time utility
The time utility runs the specified command with the given arguments. When the command finishes, time outputs a message to standard error giving timing statistics about this command run. These statistics consist of the elapsed real time between invocation and termination, the user CPU time (the sum of the tms_utime and tms_cutime values in a struct tms), and the system CPU time (the sum of the tms_stime and tms_cstime values in a struct tms).
Run
To check which part of the code caused problems, we will use profiling.

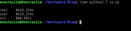
Results
As we can see, the operation of I/O doesn’t take time (real-user+sys). Almost all the time, the program is used by the CPU.
Top utility
The top utility provides a dynamic real-time view of a running system. It can display system summary information as well as a list of tasks currently being managed by the Linux kernel.
Run

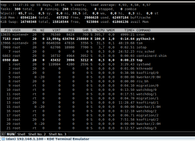
Results
We can see on the screen (pid 7183) that the command used 100% of a single kernel of CPU.
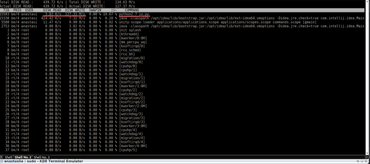
Htop utility
Htop is similar to top but allows you to scroll vertically and horizontally, so you can see all the processes running in the system, along with their full command lines.
Run

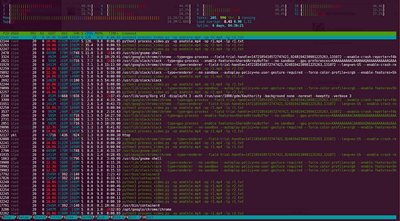
Results
We can see on the screen (pid 32145), that command does not use a single kernel of the CPU.
Check GPU usage
Nvidia-smi utility
The NVIDIA System Management Interface (nvidia-smi) is a command line utility based on top of the NVIDIA Management Library (NVML), intended to aid in the management and monitoring of NVIDIA GPU devices.
Run

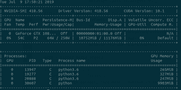
Results
In our case, almost all of the memory is used (10752 Mb). This GPU instance is fully utilized.
Check I/O
Iotop utility
Iotop watches I/O usage information output by the Linux kernel and displays a table of current I/O usage by processes or threads in the system
Runs

Results
According to the information from this post
SSD (Solid State Drive) Generally above 200 MB/s and up to 550 MB/s for cutting-edge drives
HDD (Hard Disk Drive) The range can be anywhere from 50–120MB / s
This test was run on an SSD disc so no issues with IO operations detected
Profiling
cProfile
cProfile is recommended for most users; it’s a C extension with reasonable overhead that makes it suitable for profiling long-running programs. Based on lsprof, contributed by Brett Rosen and Ted Czotter.
To run cProfile you can use instructions from the documentation or run it from the command line:
python2.7 -m cProfile -o profile.output io.py-m mod: run library module as a script (terminates option list)
– o: file with the output
Cprofile generates results in an unreadable (binary) format. To interpret the results, there are several tools to use.
Tools
Pyinstrument with a call tree:

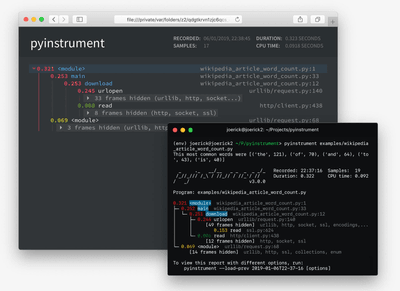
Tuna visualization:

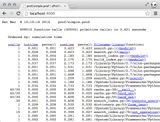
Cpofilev visualization:
You can find usage recommendations in the post.

Conclusion and Recommendations
So now you have everything to detect the problem and understand why it occurred. After that, you can decide on how to solve the issue with the detected bottleneck. You can either update your code or change environment configurations.
It is a good idea to rerun the test after fixing the root cause just to check if the problem was solved.
Hope that will help. Reach out to Quantum if you have any questions or ideas to share.
Read more: Greenspun’s tenth rule or How I was building a distributed application in Python!
Data Science Services
Quantum applies advanced statistical analysis, predictive modeling, and ML algorithms to extract patterns, validate hypotheses, and make data-driven decisions from complex datasets.
Check the service